Analytics
Analytics shows how your units, channels and messages perform: occupancy and revenue, visitors of your widgets and websites, and the delivery of your emails.
Choose the Date range at the top, such as the Last 30 days or the Next 3 months. Use Download to export the data as CSV, TSV, SSV or JSON.
Units
Occupation: per day, how many units were Booked, Closed, Unavailable, Tentatively unavailable or Available.
Revenue and Revenue per item, such as rent and each fee.
Taxes: the taxes included in the revenue.
Payments: Paid, Due and Due later.
Days booked per source: bookings made Direct versus imported from other platforms.
Filter by units and choose the Currency to convert amounts to.
Widgets
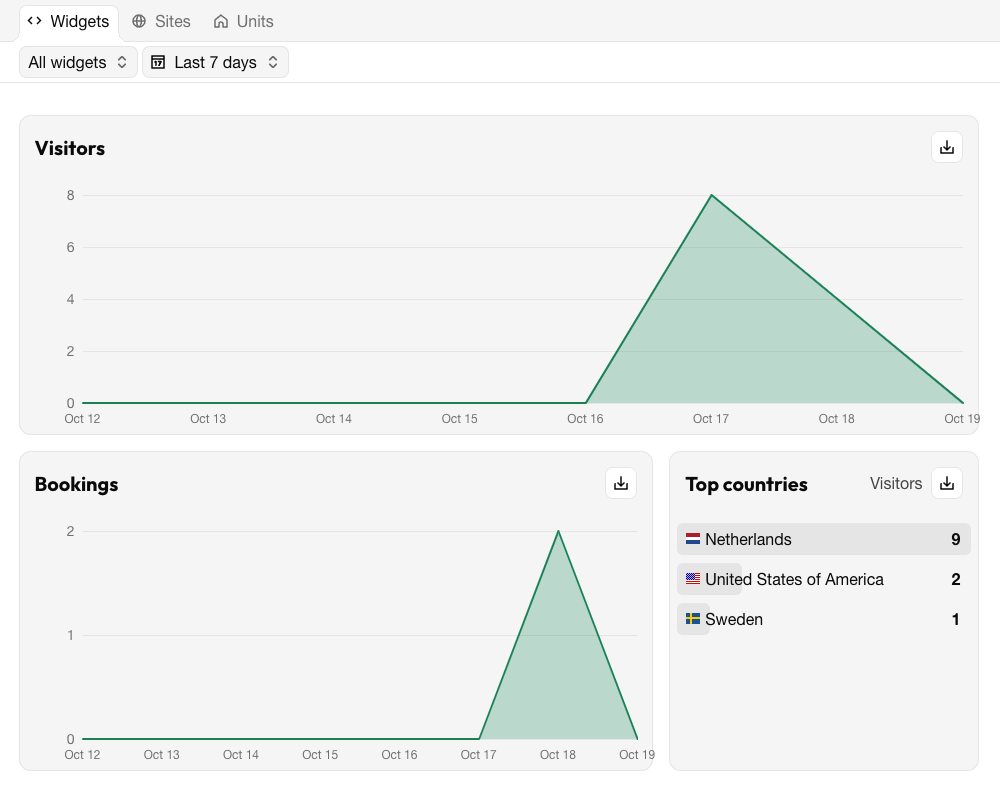
Visitors: the number of people who viewed a widget, per day.
Bookings: the number of bookings made through widgets, per day.
Top countries: where visitors come from.
Sites
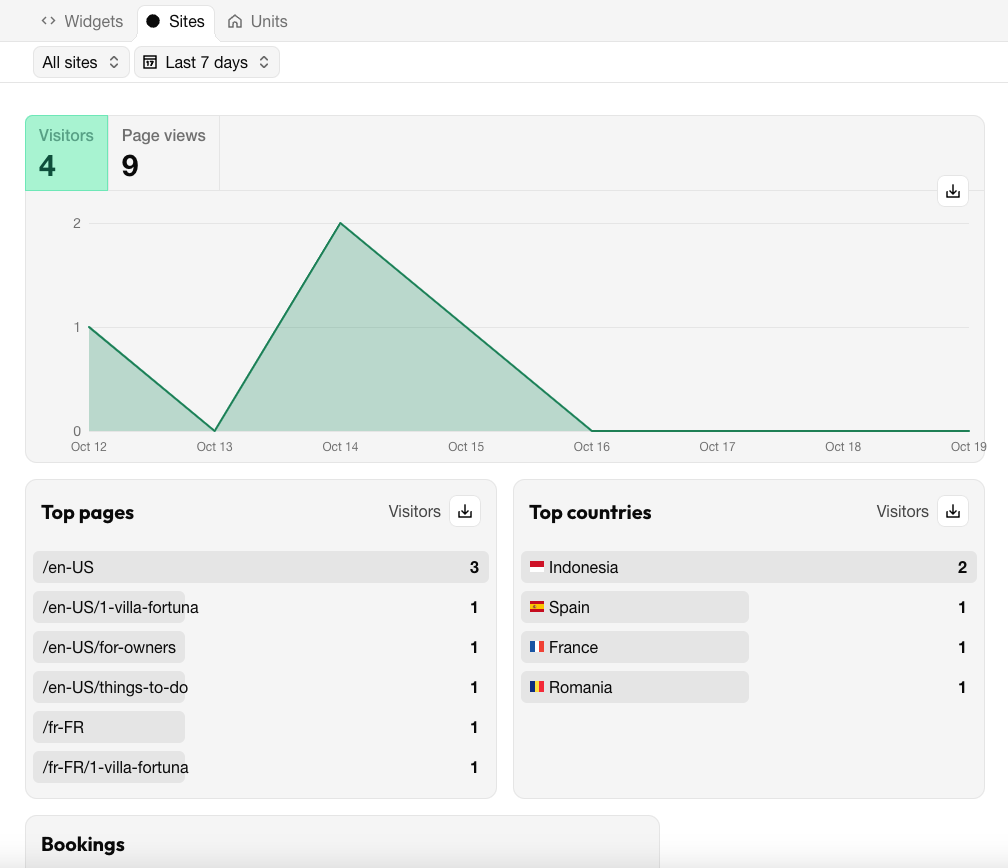
Visitors, Page views and Bookings per day.
Top pages and Top countries.
Messages
The delivery of the emails sent to guests: Sent, Delivered, Deferred, Bounced, Dropped and Spam reported. A high number of bounced emails often means guests entered a wrong address; dropped and spam-reported emails can point to a problem with your sender address.
Последнее изменение 3 ноября 2026 г.